gnuplot in Fortran
How great would it be if we can have a plotting option directly in Fortran programs? I was having trouble finding a proper way to do this. Then I came across the wonderful gnuplot software (free and open source !!). It is a command line plotting utility that can produce publication-quality plots. So what has it got to do with Fortran programs? Since gnuplot can be run from a terminal, we can ask the Fortran program to open a system terminal and ask to run gnuplot. Once gnuplot finishes plotting (to your display/ or to a file), then the control will be given back to the Fortran program to continue execution.
Here is an example Fortran program:
PROGRAM compute_plot
INTEGER :: i,n=10
REAL :: x(10),y(10)
x(1)=0.0
y(1)=0.0
DO i=2,n
x(i)=0.1*i
y(i)=x(i)*x(i)
ENDDO
OPEN(UNIT=48,FILE='data')
DO i=1,n
WRITE(48,*) x(i),y(i)
ENDDO
CLOSE(48)
CALL SYSTEM('gnuplot -p data_plot.plt')
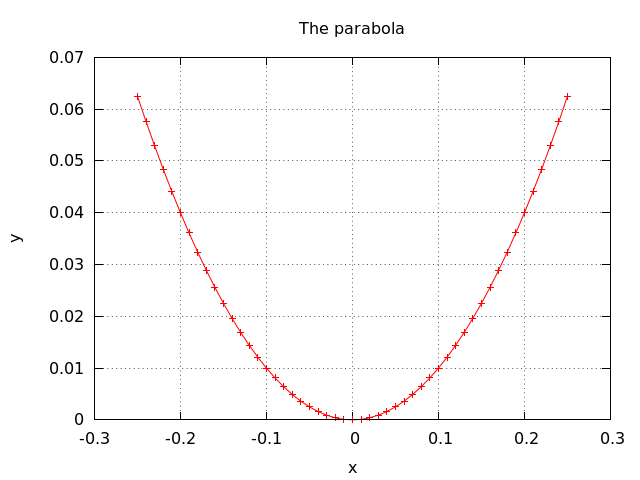
END PROGRAM compute_plotThe above Fortran program actually calculates the points on the parabola y=x^2 and then writes into the file data. gnuplot is then called to run a file named data_plot.plt which is located in the same folder as the Fortran program. The gnuplot file data_plot.plt is listed below.
set xlabel "x"
set ylabel "y"
m="./data"
set terminal x11 0
set nokey
set grid
set title 'The parabola'
plot m using 1:2 with linespoints
The following plot is displayed when the Fortran program is executed.
If you are running Ubuntu, gnuplot can be installed from terminal by the command:
$ sudo apt-get install gnuplotFor other platforms, please visit: http://www.gnuplot.info/